在kibana里其实很容易查看到具体的使用情况
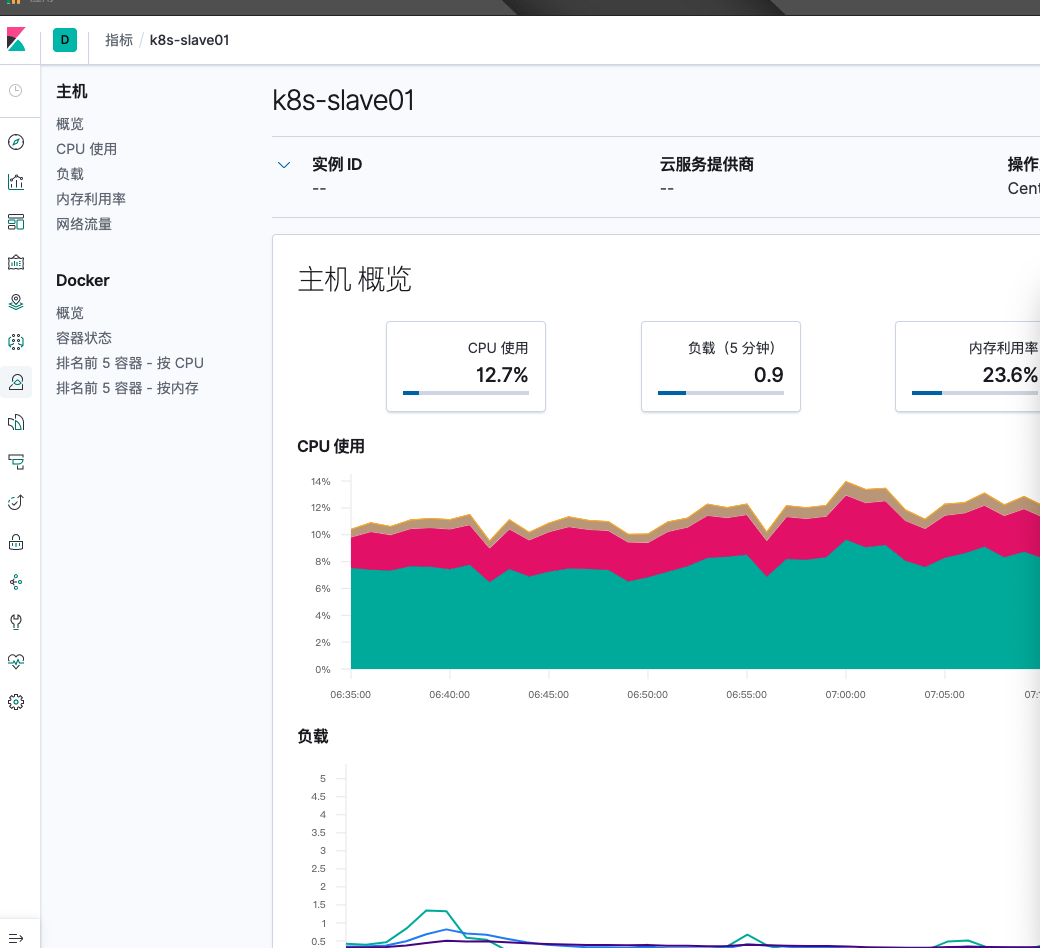
但发觉没报警机制,例如发送短信和钉钉报警(钉钉主要拉机器人,这里不做详细介绍)。
"elasticsearch/elasticsearch": "^7.0"
首先在composer里加载elasticsearch的开源组件
核心代码如下:
 public static function getSearch($type = '', $hostname = 'k8s-slave02')
    {
        $searchtype = '';
        switch($type)
        {
            case 'diskio':
                $searchtype = 'system.diskio';
                break;
            case 'network':
                $searchtype = 'system.network';
                break;
            case 'cpu':
                $searchtype = 'system.cpu';
                break;
            case 'memory':
                $searchtype = 'system.memory';
                break;
            case 'filesystem':
                $searchtype = 'system.filesystem';
                break;
            default:
                $searchtype = '';
                break;
        }
        if(empty($client))
        {
            $hosts = \SilangPHP\Config::get("Db.elasticsearch");
            self::$client = ClientBuilder::create()->setHosts($hosts)->build();
        }
        $params = [
            'index' => 'metricbeat-7.5.1',
            'type' => '_doc',
            'sort' => '@timestamp:desc',
            'size' => 1,
            'body' => [
                'query' => [
                    'bool' => [
                        'must' => [
                            [ 'match' => [ 'host.hostname' => $hostname ] ],
                            // system.diskio | docker.cpu system.network load  system.cpu system.process.summary system.process.summary
                            [ 'match' => [ 'event.dataset' => $searchtype ] ],
                        ]
                    ]
                ]
            ]
        ];
        $results = self::$client->search($params);
        $milliseconds = $results['took'];
        $maxScore     = $results['hits']['max_score'];
        $score = $results['hits']['hits'][0]['_score'];
        $doc   = $results['hits']['hits'][0]['_source'];
        return $doc;
    }
主要通过匹配搜索host.hostname主机名称和event.dataset事件来获取相关信息,为了获取最新的来报警,排序使用@timestamp:desc时间倒序来获取。
汇总发送效果
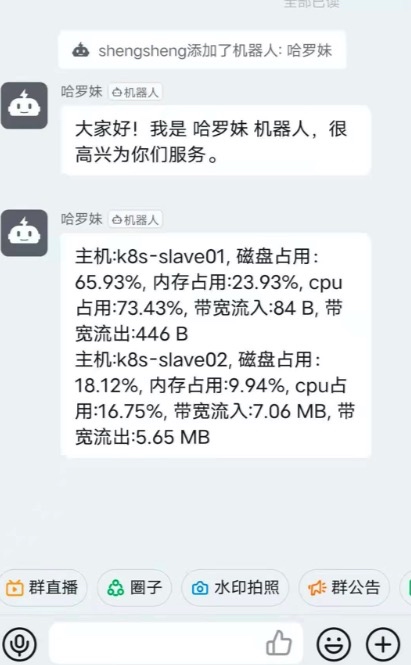
规则报警得大家自己去定义,例如内存高于80%的时候触发报警。
使用过某些开源的监控工具,其实也没精力去学习更多,也相对复杂,简单有简单的好处。
相比第一版报警系统,现在的其实可观很多_^