ELK(elasticsearch、logstash、kibana),使用这个套件分析数据
logstash占用比较大,实际只用了filebeat作为分析使用。
搭建
自己可以根据docker来搭建,当然也可以直接使用腾讯云的elasticsearch service服务。
客户端
在客户端装上filebeat
curl -L -O https://artifacts.elastic.co/downloads/beats/filebeat/filebeat-7.5.1-x86_64.rpm
sudo rpm -vi filebeat-7.5.1-x86_64.rpm
编辑/etc/filebeat/filebeat.yml内容
filebeat.config.modules:
  path: ${path.config}/modules.d/*.yml
  reload.enabled: true
  reload.period: 10s
setup.kibana:
  host: "xxxx.kibana.tencentelasticsearch.com:5601"

output.elasticsearch:
      hosts: ["172.16.16.8:9200"]
      protocol: "http"
      username: "elastic"
      password: "xxx"
这里使用nginx module,上报一下nginx
filebeat modules enable nginx
filebeat modules list  # 查看启动之后的模块
# /etc/filebeat/modules.d/nginx.yml 填写相关nginx日志文件
filebeat setup
systemctl start filebeat
# 可使用filebeat -e 测试并打印一下
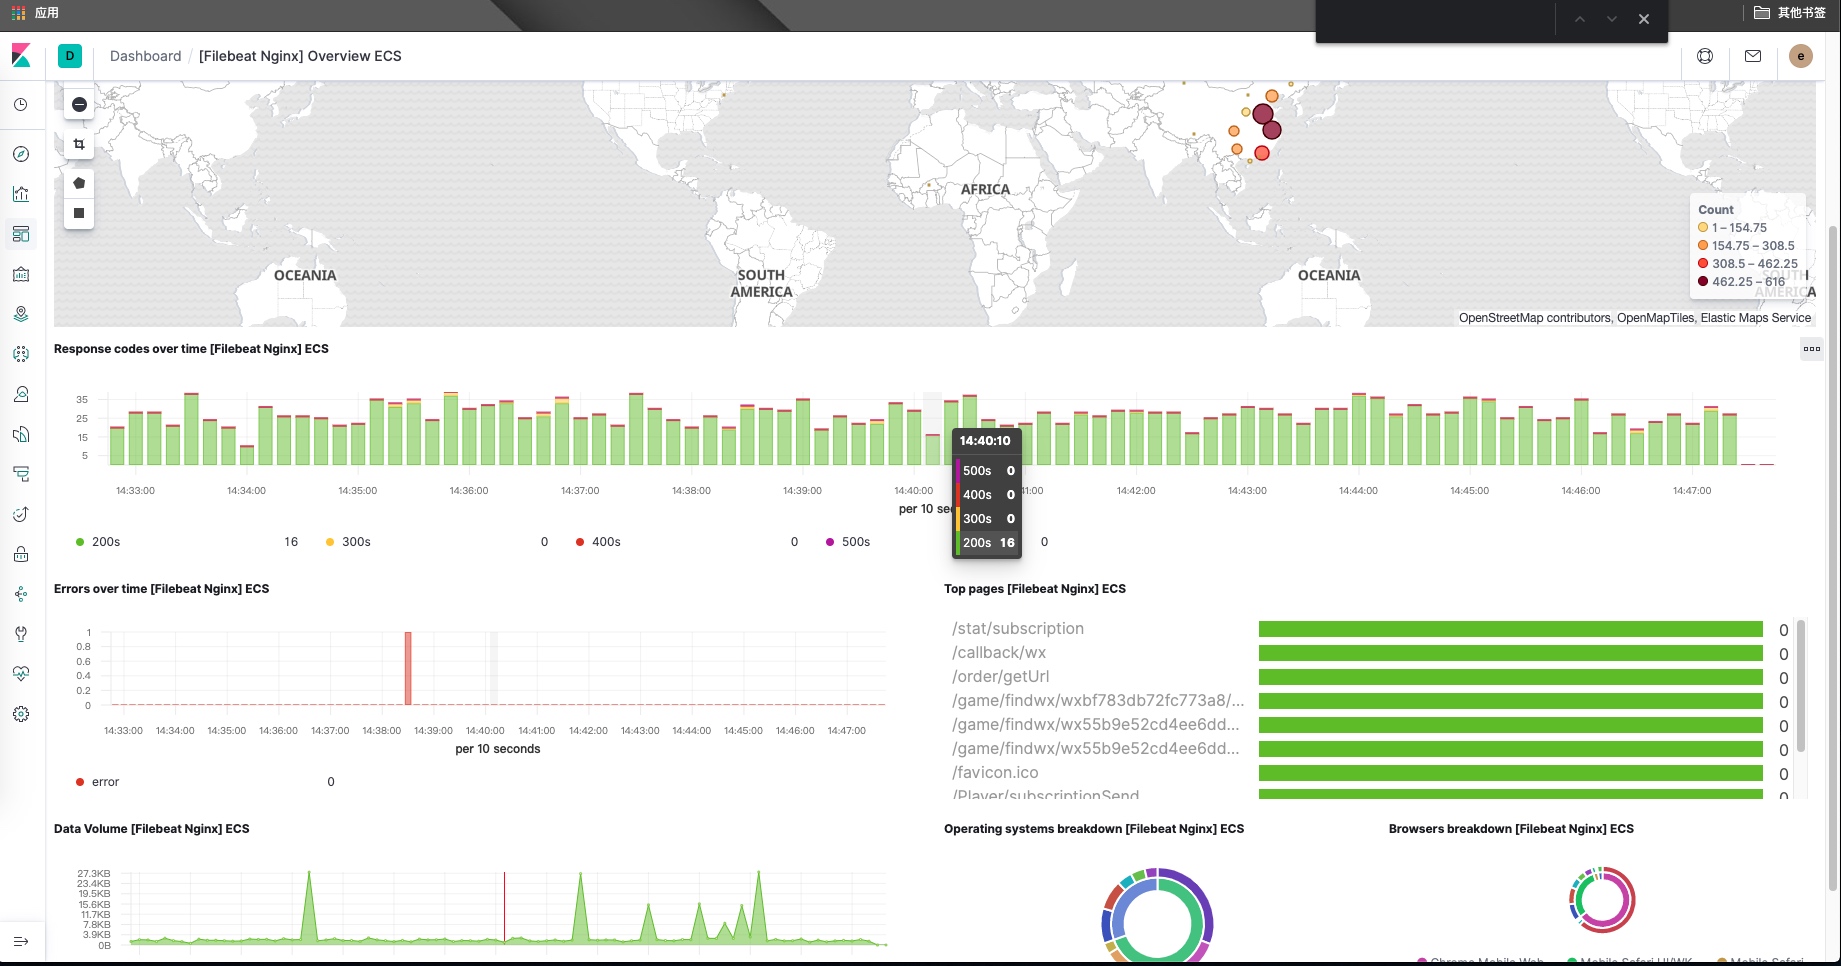
回到kibana查看dashboard与日志
nginx数据
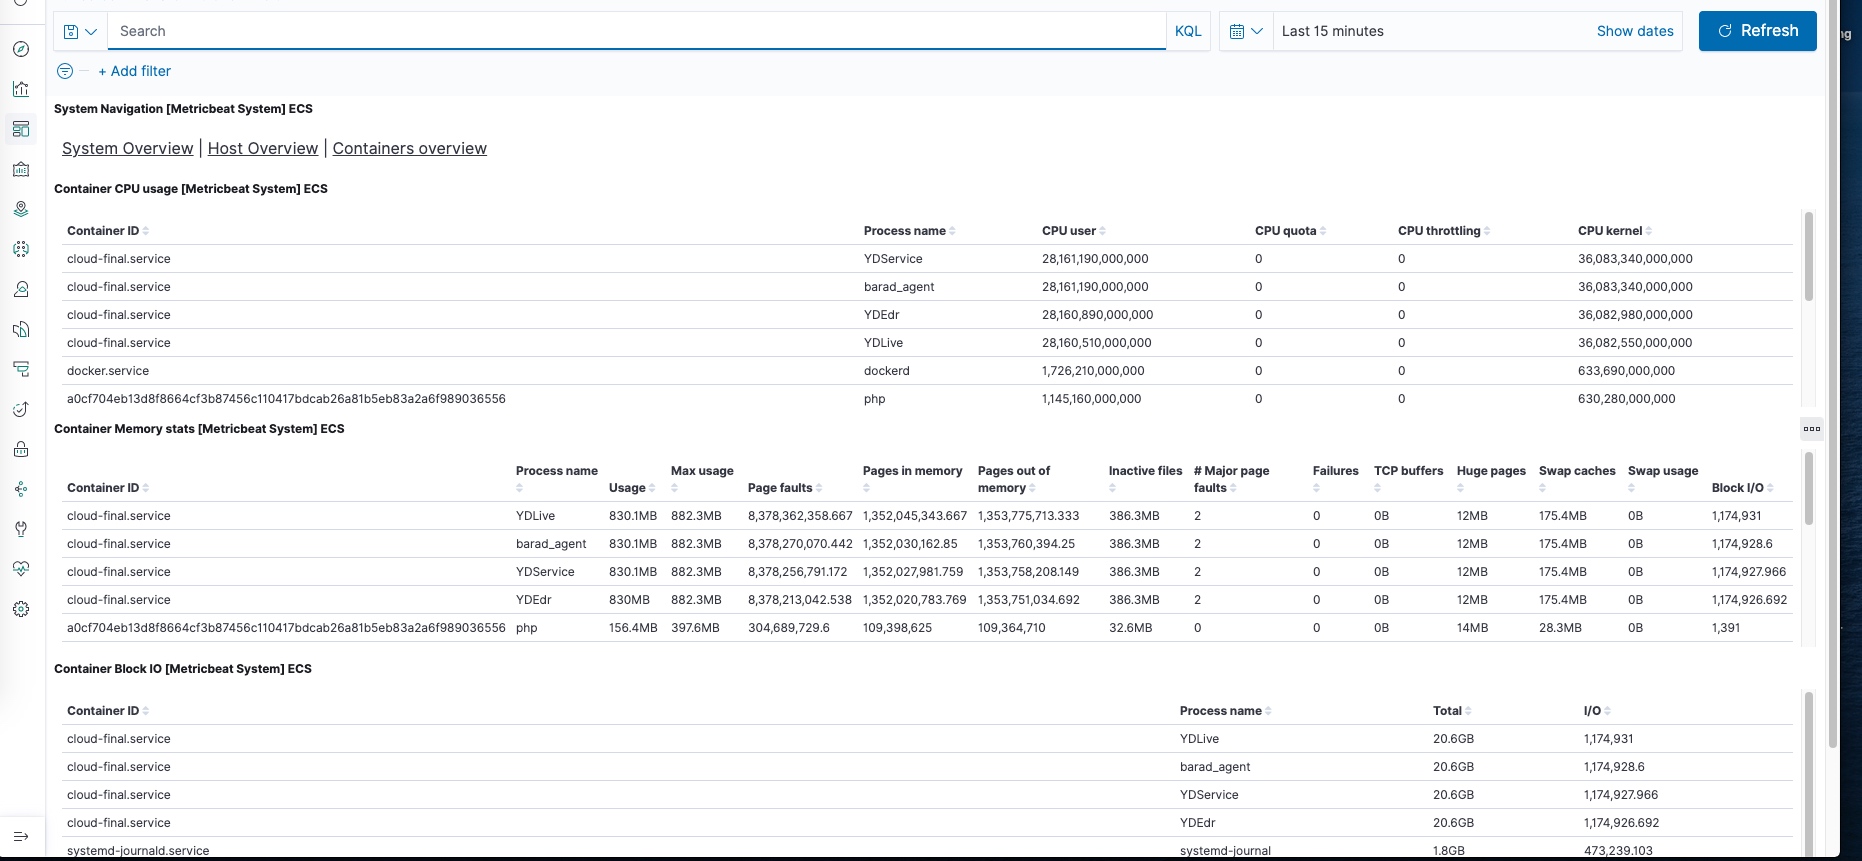
系统cpu
总结
使用云服务不用懂配置,直接就能使用了,相对监控来说,elk这块使用上更方便。